Free OnlineTreemap Generator With AI
How to Create a Treemap with AI
Define the Comparison
Reference Your Data
Generate and Check the Hierarchy
Reduce Clutter and Export
Why Use Mew Design for Treemap Creation
Bring in CSV and Excel Context
Upload CSV or XLSX files to the dedicated file library and reference them with @. Our AI treemap generator can use the selected hierarchy and value columns as source context for the chart design.
Brief the Chart in Plain Language
Describe the business question instead of manually arranging rectangles. Ask for a budget allocation treemap, portfolio view, sales breakdown, or market share chart and specify what each visual encoding should mean.
Separate Area From Color
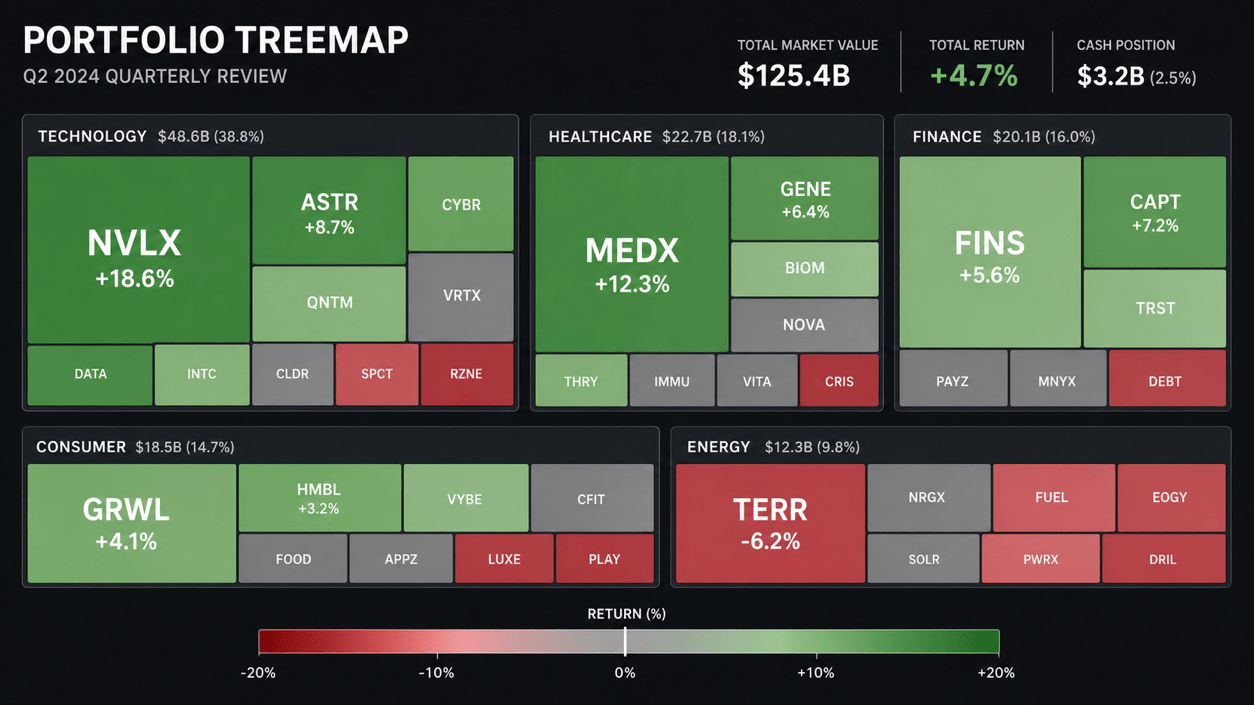
Use tile area for the main quantity and color for a group or second measure. This makes a portfolio treemap more useful when size shows market value and a diverging palette shows positive or negative return.
Keep Small Tiles Under Control
The online treemap maker can follow instructions to show two or three hierarchy levels, label the largest rectangles, combine a long tail as Other, and add a legend that explains size and color.
Adapt the Visual to Your Brand
Reference a logo or brand asset, request accessible contrast, and align typography and color with an existing report. Chat Edit lets you revise grouping, labels, spacing, and presentation emphasis through conversation.
Prepare Report and Slide Variants
Generate focused versions for an executive summary, landscape presentation, or detailed report page. Review every figure and label, then export a watermark-free PNG, JPG, or PDF using your available credits.
How to Structure Data for a Treemap
- Parent: The top-level group, such as Sector, Department, Region, or Site Section.
- Item: The child category inside each parent, such as Company, Program, Product, or Page.
- Size: A nonnegative value that controls rectangle area, such as revenue, budget, market value, sessions, or storage.
- Color: An optional category or second metric. Use a clear legend and a meaningful midpoint when color shows positive and negative change.
Treemap Templates for Common Data Questions
Portfolio allocation: Group Sector > Holding, size by Market Value, and color by Return. Label the largest holdings and group the long tail as Other.
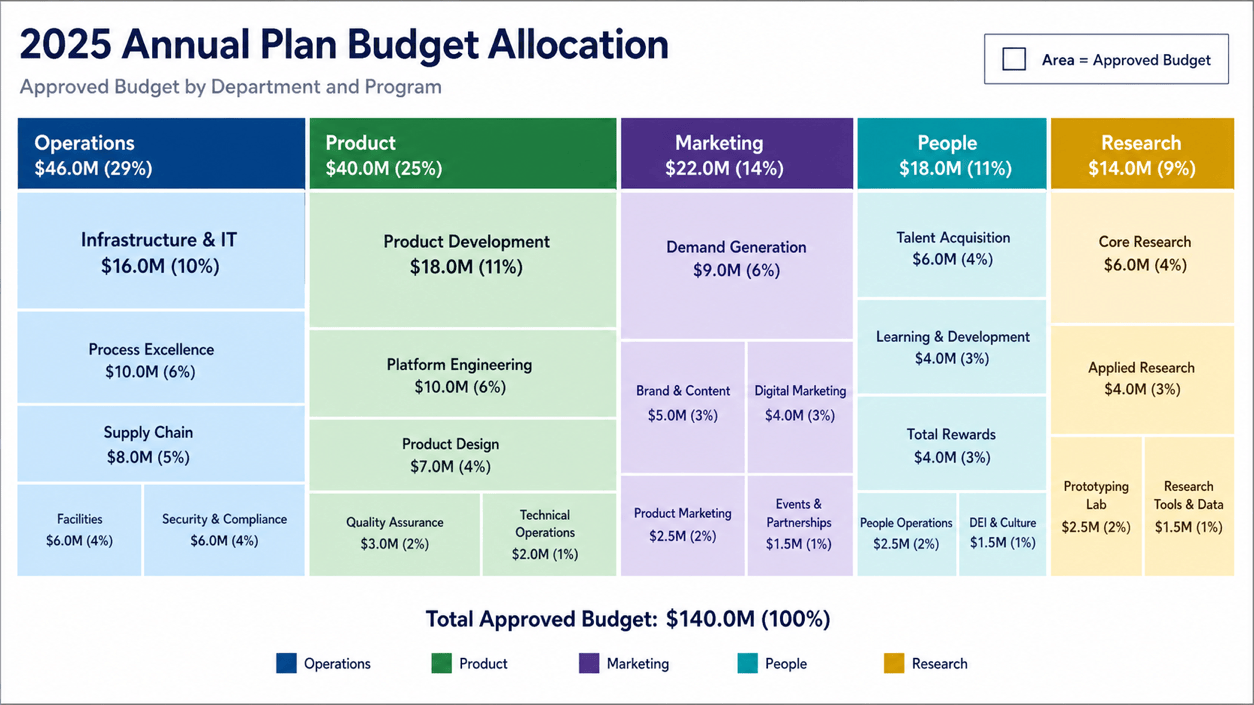
Budget breakdown: Group Department > Program, size by Approved Budget, show percentages of total, and use one accessible color family per department.
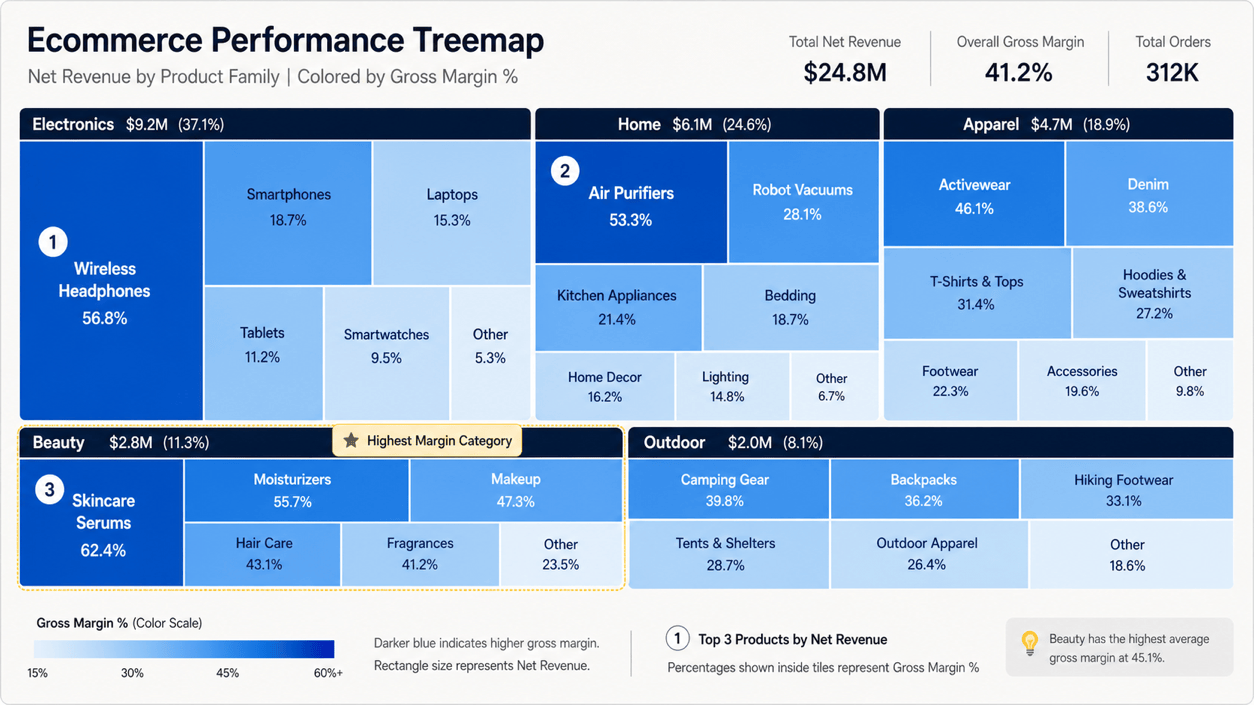
Sales performance: Group Category > Product, size by Revenue, color by Margin, and call out the largest or highest-margin contributors.
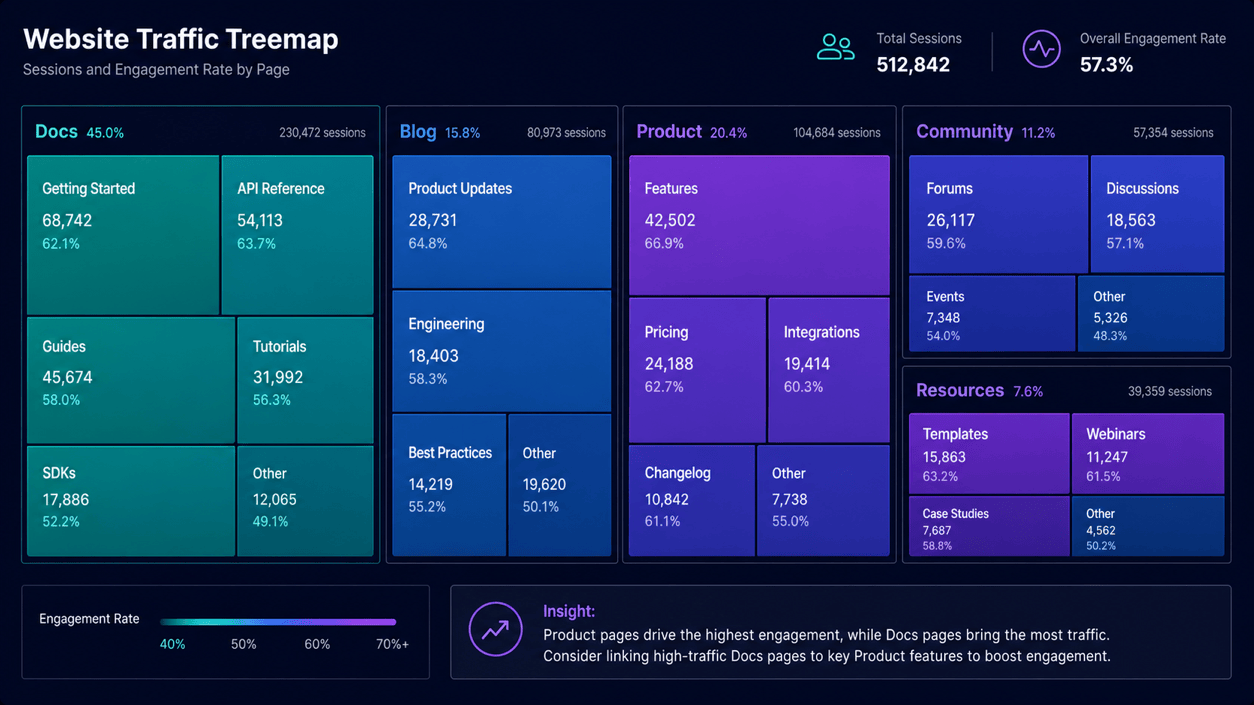
Website traffic: Group Site Section > Page, size by Sessions, color by Engagement Rate, and label only the most important pages.