Free OnlineAI Diagram Generator

How to Create a Diagram with AI
Define the Question and Diagram Type
List Nodes, Connections, and Sources
Generate and Check the Logic
Revise, Simplify, and Export
Build Diagrams Around Real Structure, Not Just Shapes
Match the Visual to the Relationship
Describe whether the information is sequential, hierarchical, interconnected, comparative, or exploratory. This online AI diagram maker can turn that intent into a flowchart, process map, system view, decision tree, org chart, user flow, or concept map instead of forcing every idea into the same layout.
Create From Notes, Documents, or URLs
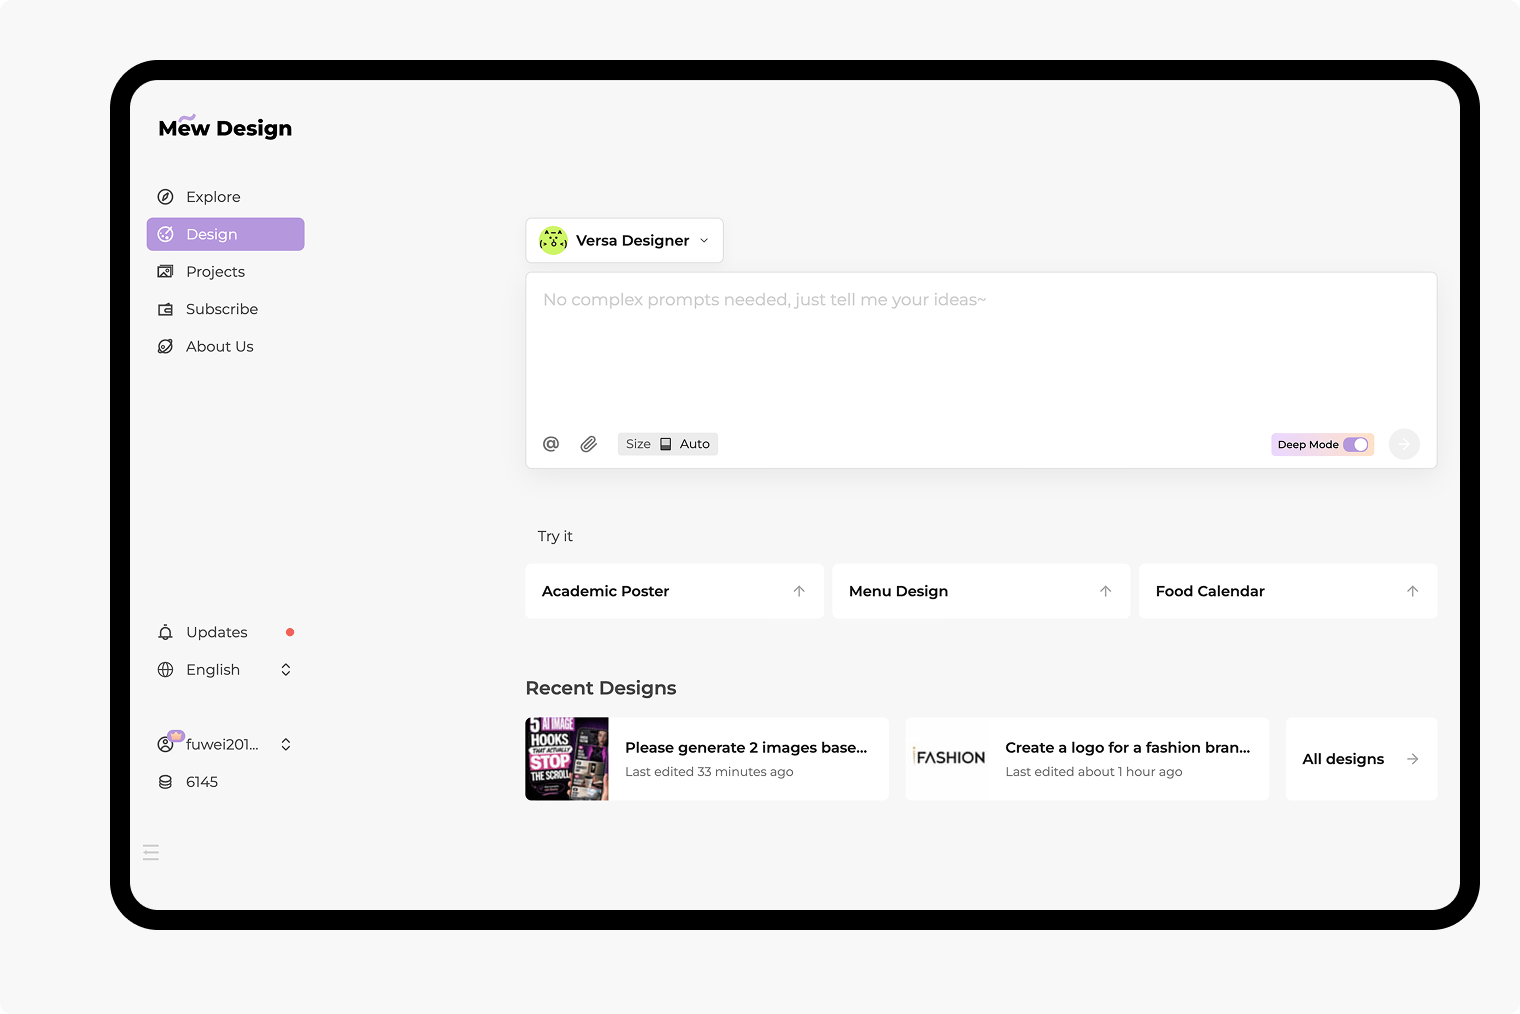
Move beyond a short prompt when the source matters. Reference uploaded requirements, reports, spreadsheets, presentations, or notes with @, or provide an accessible page URL when crawling is allowed. Mew can use the relevant content to draft the diagram, but you should compare the result with the source before relying on it.
Keep Complex Systems Readable
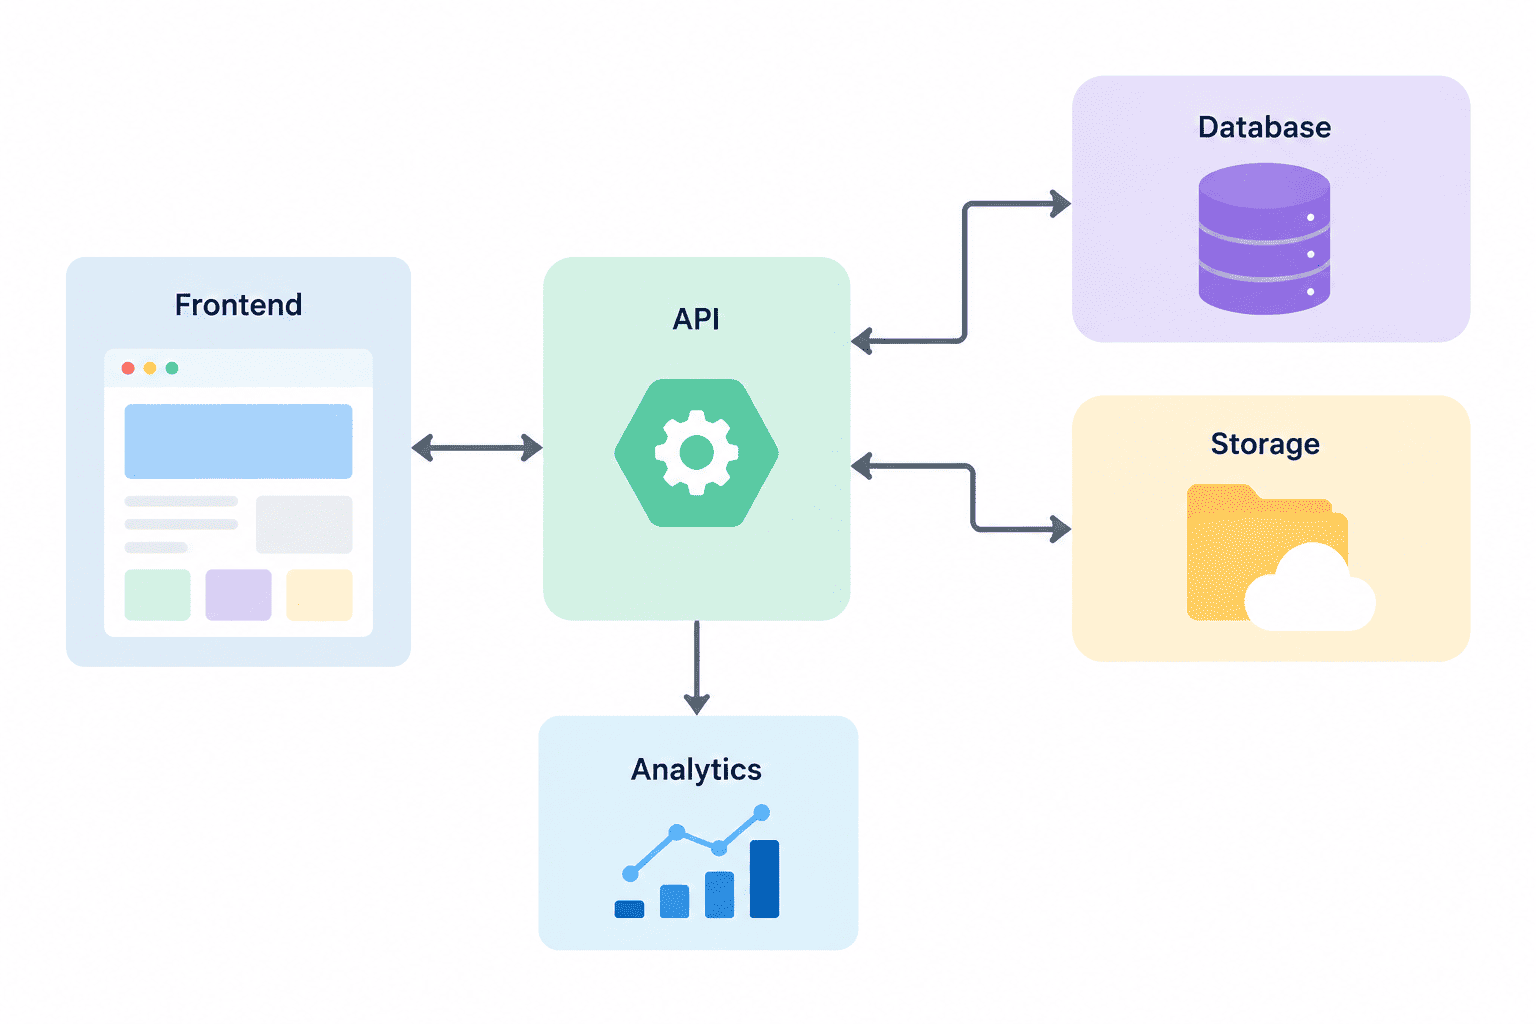
An AI system architecture diagram generator must balance detail with comprehension. Ask for clear system boundaries, labeled interfaces, grouped services, consistent connector direction, a legend, and separate high-level and detailed views when one canvas would become crowded.
Correct Nodes and Connections in Chat
Diagrams often improve after the first review. Tell Chat Edit exactly which branch points to the wrong destination, which step is missing, where a loop returns, or which label needs clarification. You can restructure the draft without rewriting the complete brief.
Adapt the Diagram to Its Audience
Use restrained technical styling for engineering documentation, a simple left-to-right flow for a client presentation, clear swimlane-like grouping for an operating process, or branded colors for a workshop visual. Upload an authorized logo or reference image when the design must align with existing materials.
Export an Honest Static Visual
Download the reviewed design as PNG, JPG, or PDF. Mew Design does not promise standards-compliant UML, BPMN, or ERD validation; automatic codebase or live-data synchronization; diagram-as-code; layered diagram files; SVG; Visio; draw.io; or editable PowerPoint output. Treat technical diagrams as communication drafts that require subject-matter review.
How to Brief AI for a Useful Diagram
- Choose the relationship: Say whether you need to show sequence, decisions, hierarchy, system dependencies, information flow, or conceptual links. Request a specific diagram type only when it fits that relationship.
- Define every element and edge: List actors or nodes separately. Then state who connects to whom, the direction, connector label, branch condition, loop, exception, ownership, or reporting line. Do not hide critical logic inside one long paragraph.
- Reference the source precisely: When using a file, attach it through the file library, reference it with @, and identify the pages, headings, rows, columns, or requirements to visualize. Say what the AI may summarize and what wording must remain exact.
- Control scope and verification: Set the audience, reading direction, canvas ratio, maximum depth, grouping, color rules, and excluded details. Ask for separate overview and detail views when needed, then verify every path and claim against the source.
AI Diagram Prompts for Systems, Processes, and Ideas
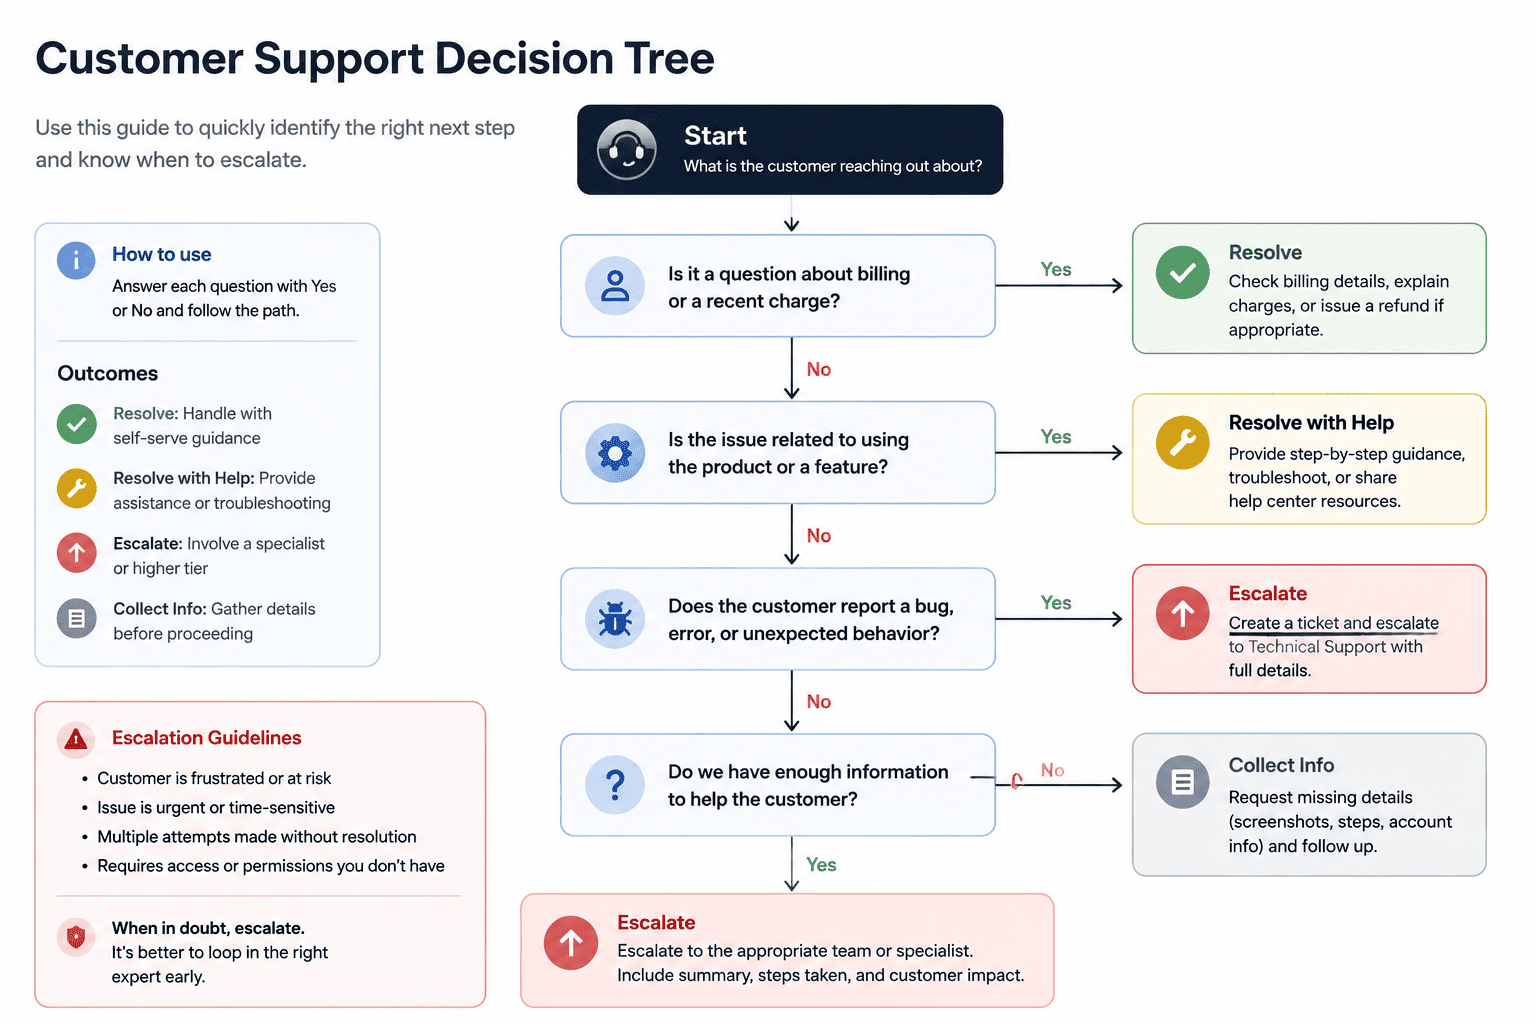
Support Ticket Decision Flow: Create a top-to-bottom flowchart for a support team. Start: New Ticket. Decisions: security incident, account access issue, billing issue, product bug, or general question. Route security incidents to Incident Lead immediately; account access to Identity Queue; billing to Finance Support; product bugs to Triage with severity check; general questions to Knowledge Base Review. Show escalation, customer update, resolution, and closed states. Label every Yes/No branch and do not invent response-time commitments.
SaaS Architecture Overview: Create a 16:9 conceptual system architecture diagram for a fictional project-management app. Show Web Client, Mobile Client, API Gateway, Auth Service, Project Service, Notification Service, PostgreSQL, Redis, Object Storage, Email Provider, and Monitoring. Group internal and external systems, label data flows, and show only the components supplied. Use a clean technical style; do not imply verified deployment, security, or cloud regions.
PRD to User Flow: Read @checkout-prd.pdf, sections 'Guest Checkout', 'Payment Failure', and 'Order Confirmation'. Create a mobile checkout user-flow diagram covering entry points, address validation, shipping choice, payment authorization, recoverable errors, cancellation, and success. Preserve the exact screen names and decision rules from the PRD, flag missing transitions, and add no screens that the source does not support.
Org Chart From a Spreadsheet: Use @team-directory.xlsx, sheet 'Current Team', columns 'Name', 'Role', 'Manager', and 'Function'. Create a functional org chart with the General Manager at the top, departments grouped by function, and dotted-line advisory relationships only where the source marks them. Do not infer missing managers, seniority, or vacant roles. Use readable names and a landscape layout.
Incident Response Process Map: Create a cross-functional process diagram for a fictional SaaS outage. Lanes: Monitoring, On-Call Engineer, Incident Commander, Communications, and Service Owner. Show detection, validation, severity decision, mitigation, status updates, recovery check, postmortem scheduling, and closure. Label handoffs and feedback loops, use red only for active incident states, and do not invent regulatory steps or timing targets.
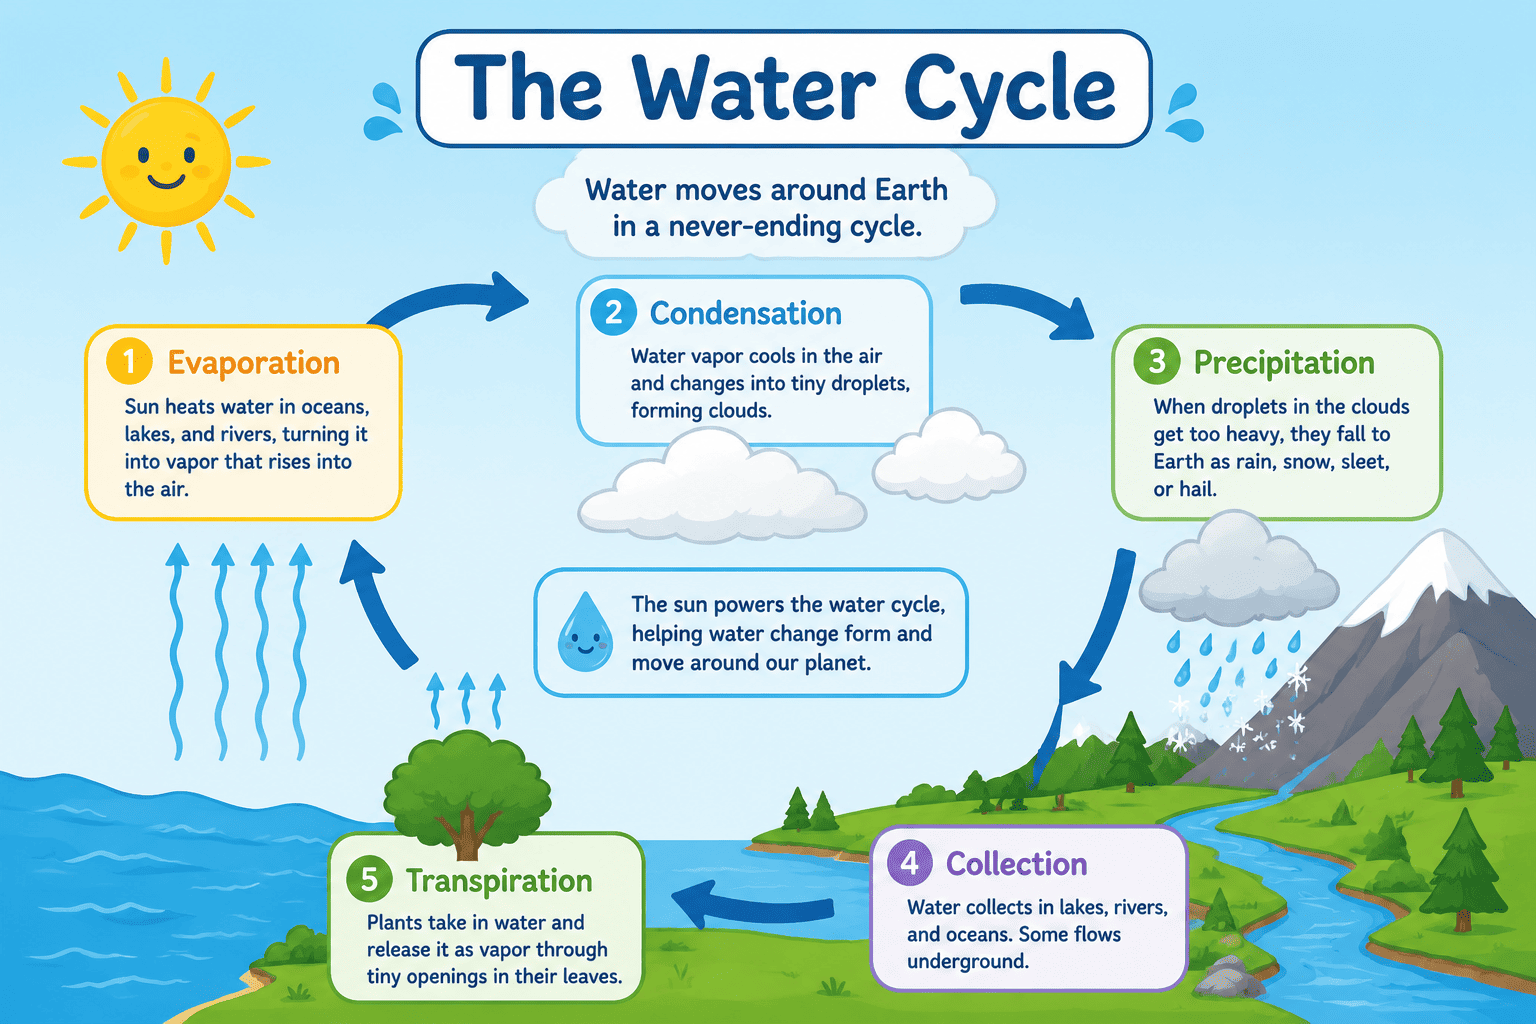
Educational Concept Map: Create a concept map explaining the water cycle for middle school students. Central idea: Water Cycle. Connect evaporation, transpiration, condensation, precipitation, runoff, infiltration, groundwater, and collection with short relationship labels. Add solar energy and gravity as drivers. Use accessible blue and green colors, large type, simple science illustrations, and no unsupported percentages or climate claims.