Free OnlineAI Venn Diagram Generator
How to Create a Venn Diagram with AI
Name the Sets and the Purpose
Assign Unique and Shared Content
Generate and Inspect Every Region
Refine the Diagram and Export
Build Venn Diagrams Around the Relationships That Matter
Turn Plain Language into Labeled Regions
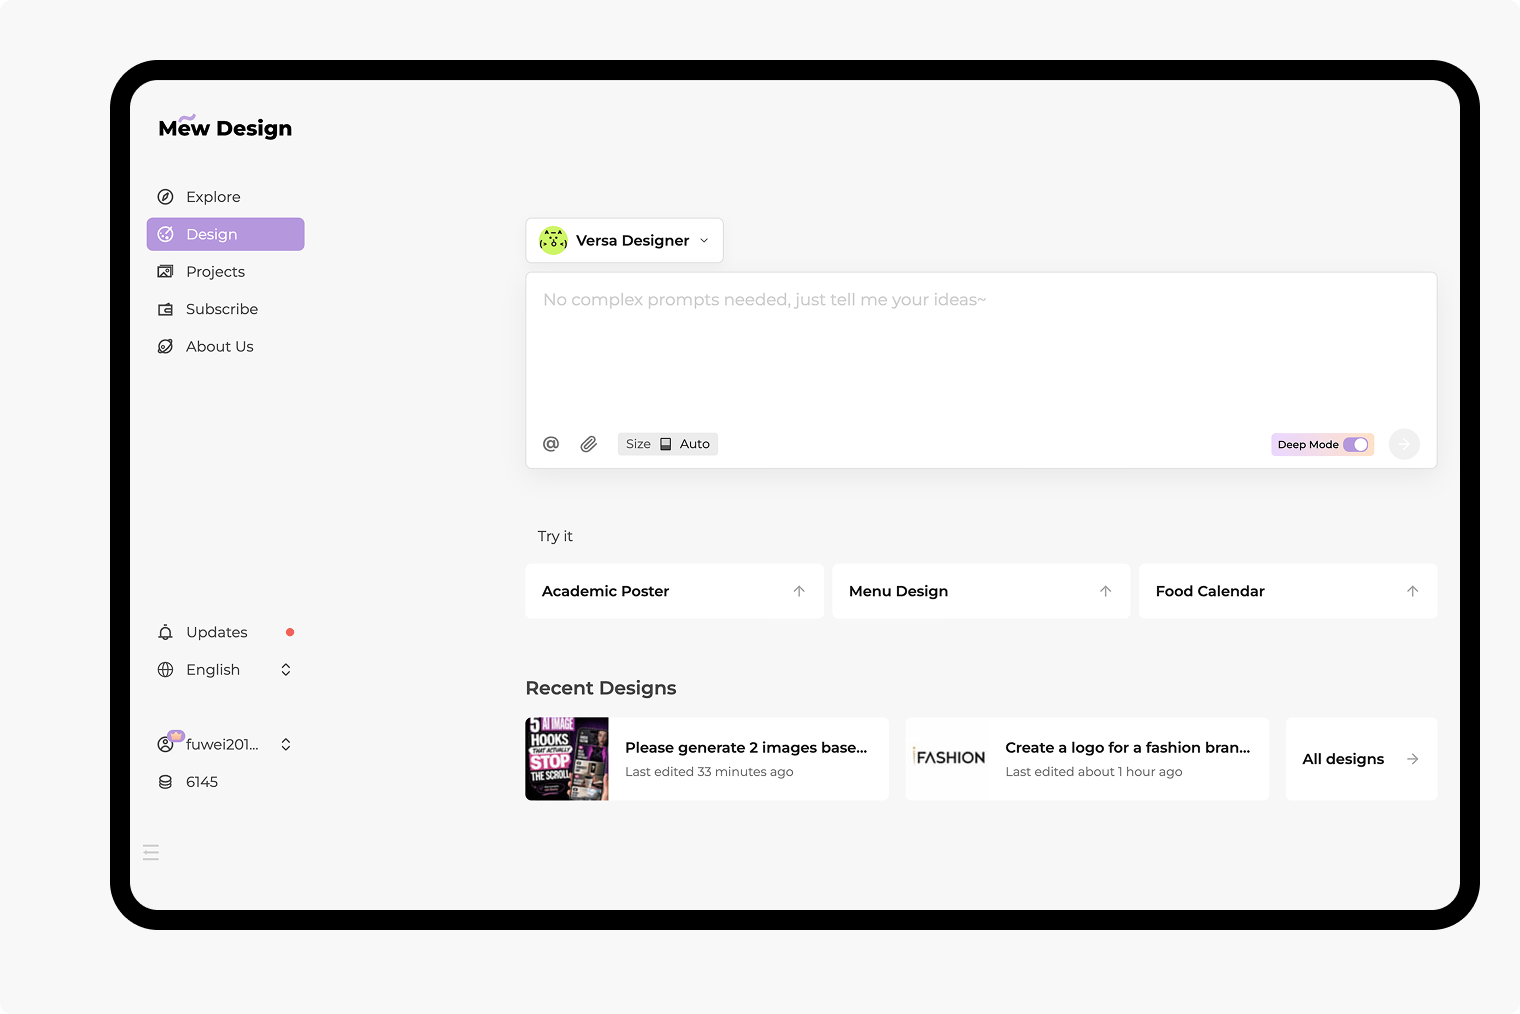
Describe the two or three things being compared and provide their unique and shared traits. Mew Design can translate that brief into set labels, exclusive regions, pairwise overlaps, and a shared center, giving you a structured visual draft instead of an empty circle template.
Reference Notes, Lists, and Source Files
Upload source material to the dedicated file library and reference up to three documents with @ in one message. Mew can use relevant content from a worksheet, report, presentation, spreadsheet, CSV, or notes file while drafting the diagram. Always compare the result with the source, especially when item membership or numerical intersections matter.
Keep Three-Set Intersections Readable
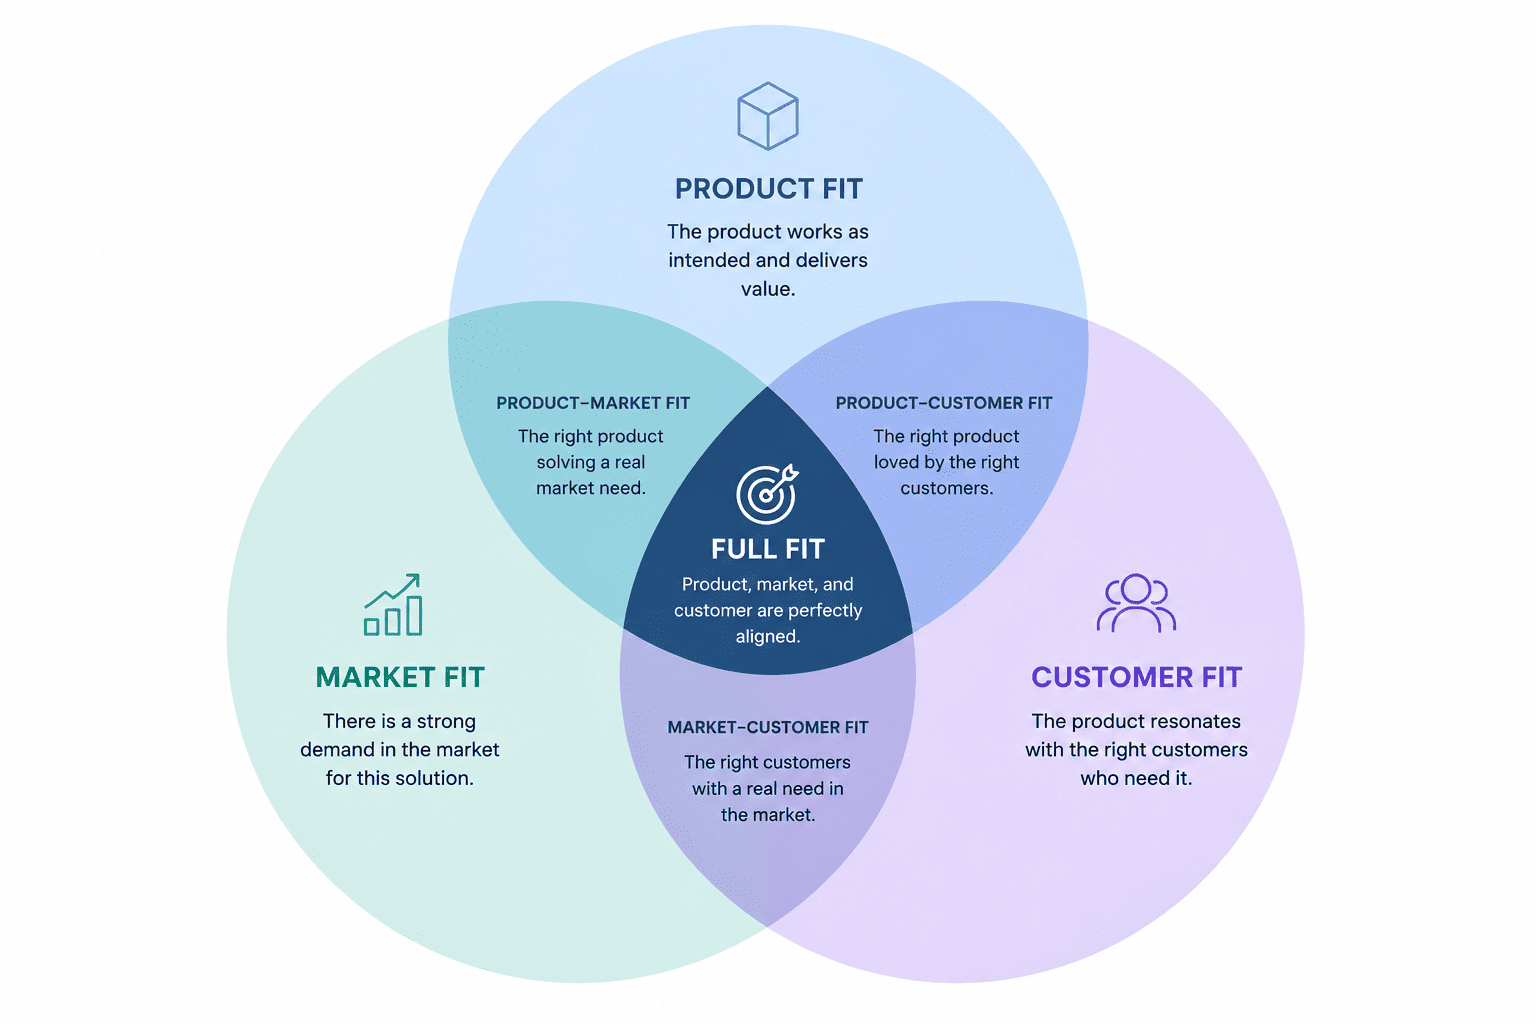
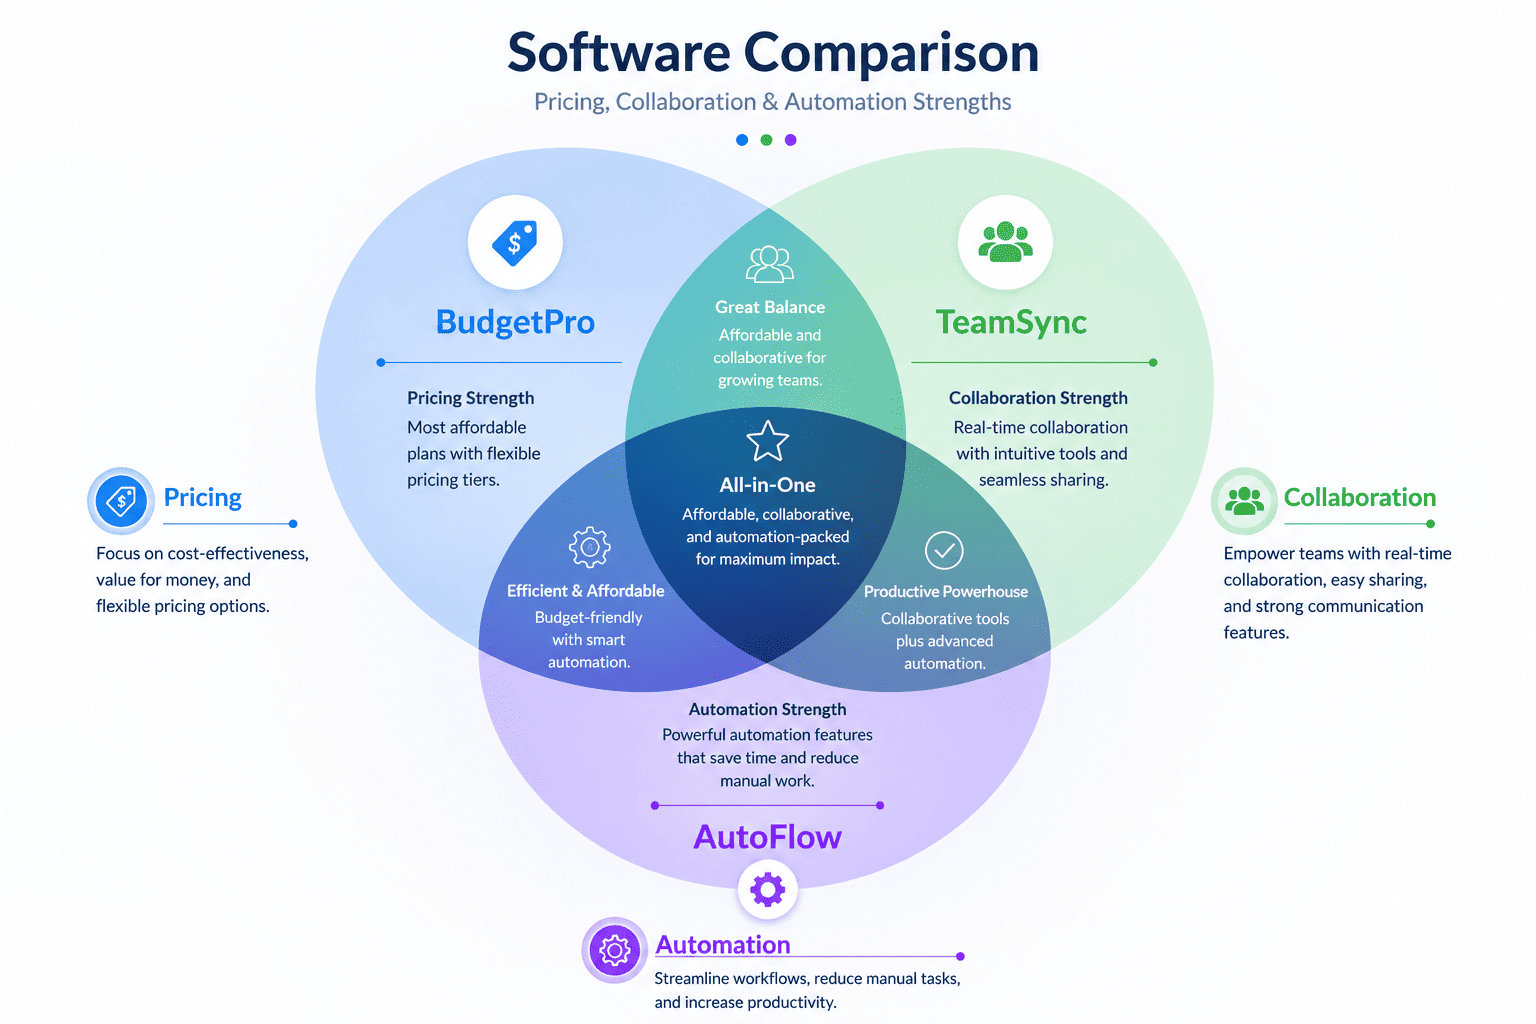
A three-circle Venn diagram generator must account for three unique regions, three pairwise overlaps, and one central intersection. Ask for short labels, translucent fills, deliberate spacing, and visible boundaries so readers can tell which set owns each statement without tracing crowded shapes.
Correct the Logic Through Conversation
If an item is in the wrong region, tell Chat Edit exactly where it belongs. You can also rename a set, split one long statement, remove an unsupported similarity, add a missing intersection, or request a two-circle version without rebuilding the visual brief from the beginning.
Adapt the Visual to the Audience
Use this compare-and-contrast Venn diagram maker for a printable classroom activity, a restrained executive slide, a colorful workshop graphic, or a branded product analysis. Upload an authorized logo or visual reference when the colors and style should match existing materials.
Export a Reviewed Static Diagram
Download the final static design as PNG, JPG, or PDF. Mew Design does not guarantee statistically validated intersections, area-proportional circles, direct spreadsheet synchronization, layered diagram files, SVG, or editable PowerPoint output. For dense comparisons across four or more sets, consider a matrix, table, Euler diagram, or UpSet-style chart instead.
How to Brief AI for a Clear Venn Diagram
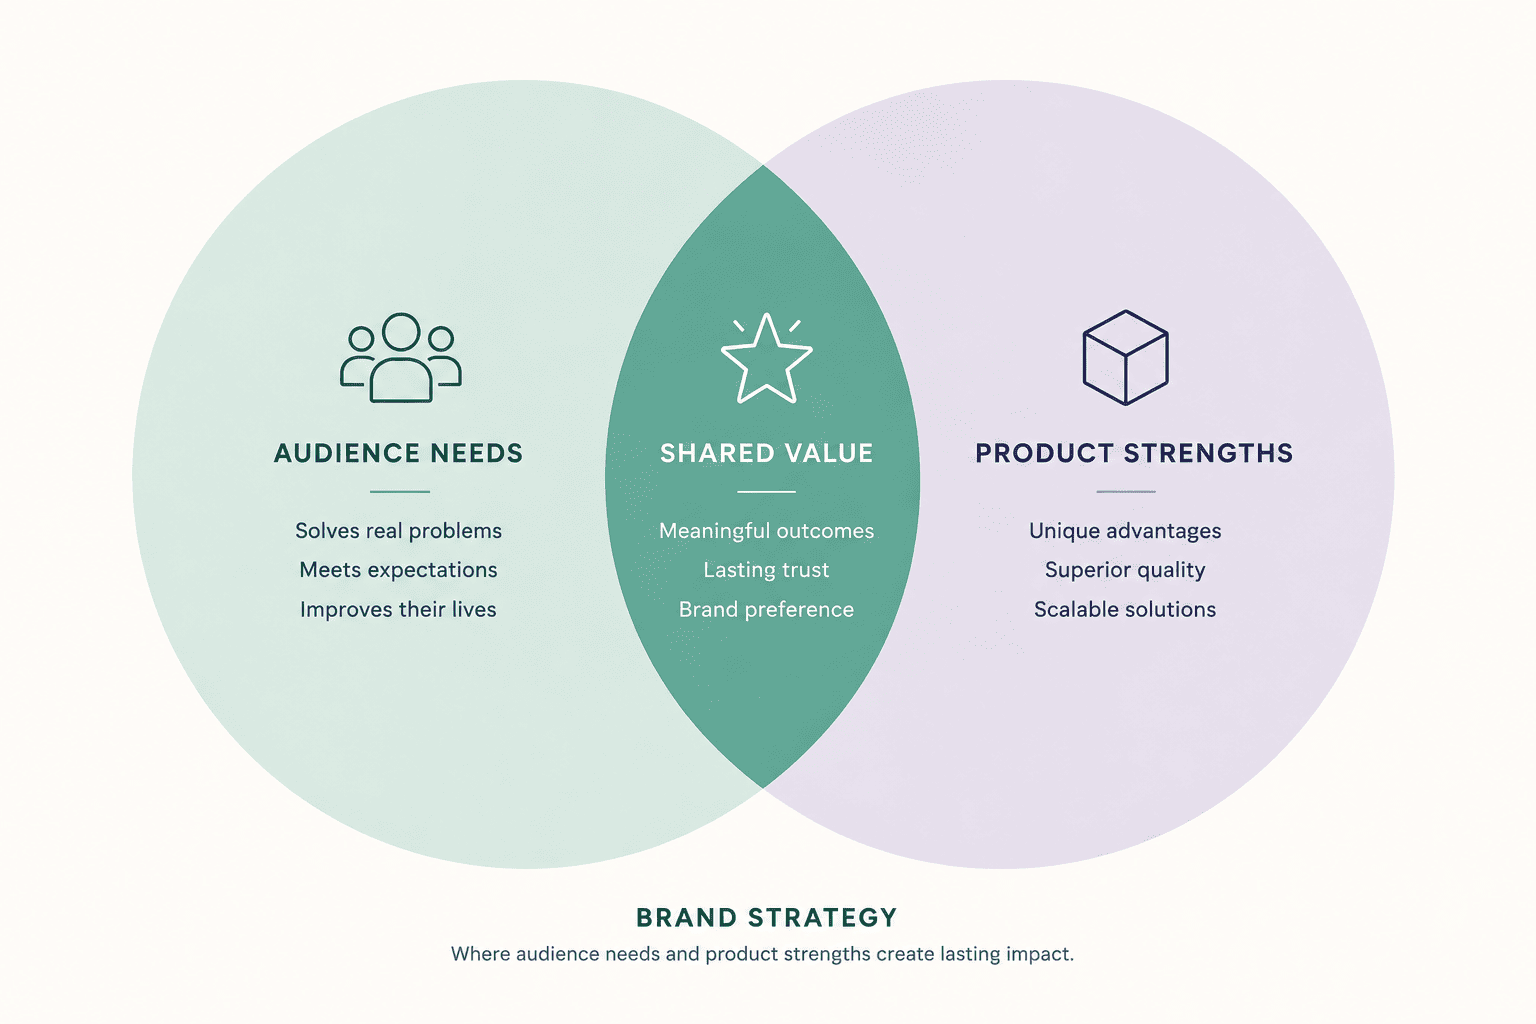
- Choose the right set count: Use two circles for a direct compare-and-contrast task. Use three only when all three pairwise overlaps and the shared center carry useful information. More sets can quickly make the diagram hard to read.
- Provide region-by-region content: Do not give one mixed paragraph. Label entries as Set A only, Set B only, A + B, and, for three sets, A + C, B + C, and A + B + C. Keep each entry short enough to fit inside the intended region.
- Reference the source precisely: When using a document or spreadsheet, attach it through the file library, reference it with @, and identify the pages, sheet, columns, filters, or lists to compare. State whether the values are examples, verified data, or notes that still need review.
- Set the visual and accuracy rules: Specify presentation, worksheet, report, or print use; desired size; color and contrast; maximum text per region; and facts the AI must not infer. Verify all labels, membership, quantities, and calculations before sharing.
AI Venn Diagram Prompts for Learning and Analysis
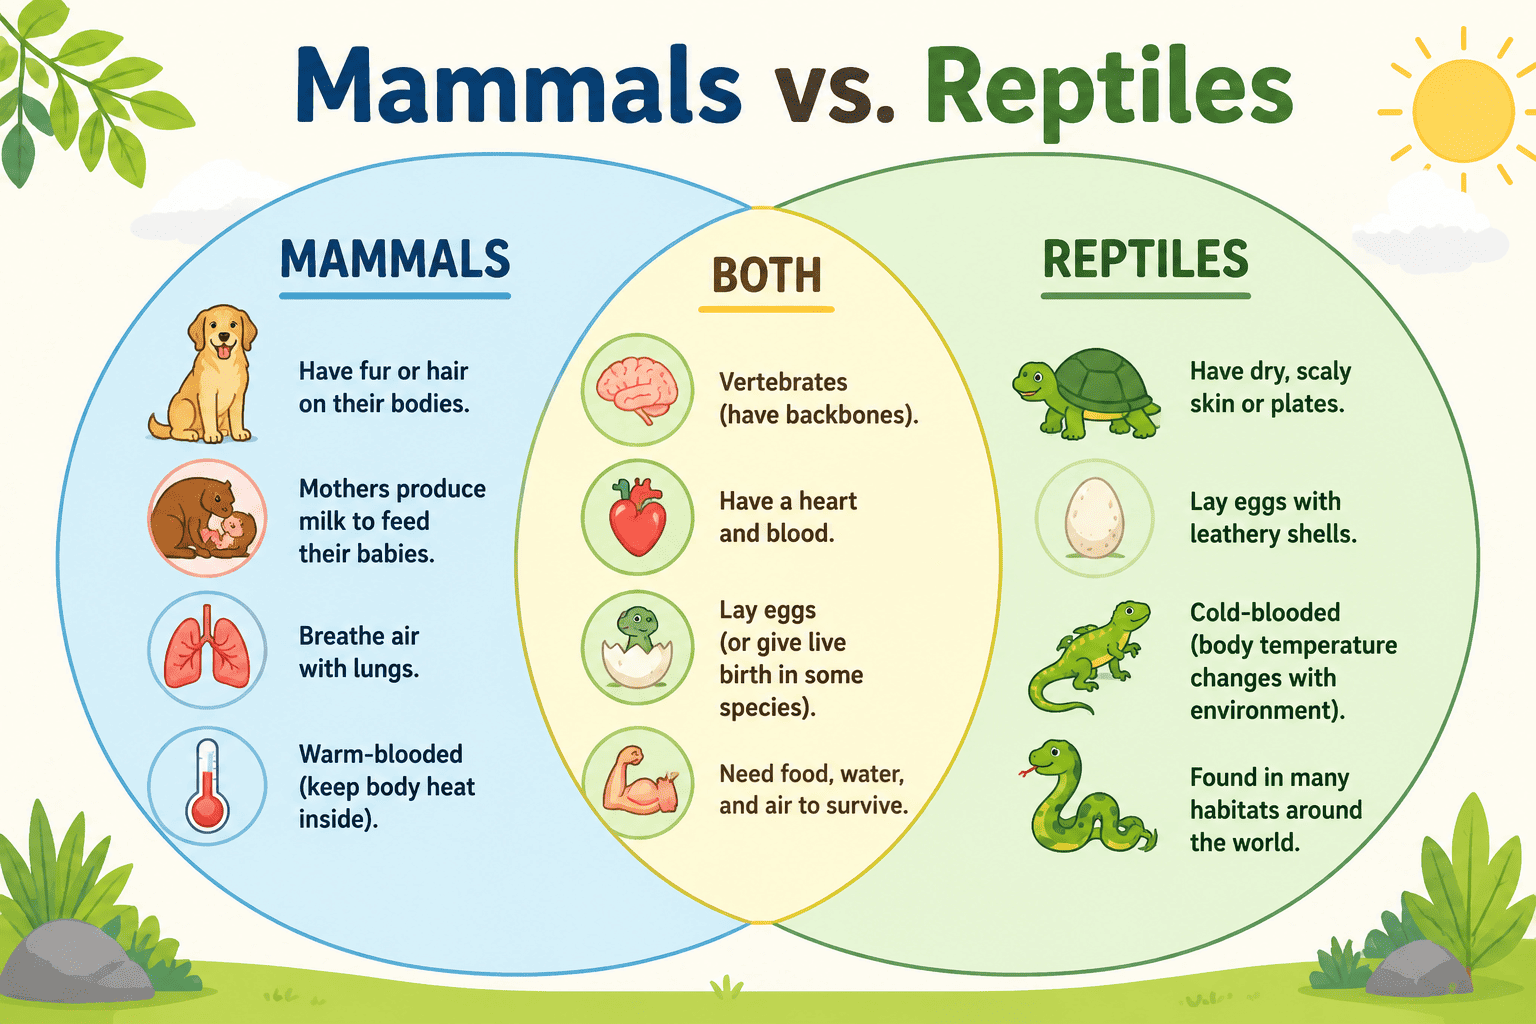
Classroom Compare and Contrast: Create a printable two-circle Venn diagram comparing mammals and reptiles for a middle school science lesson. Mammals only: hair or fur, produce milk, usually give live birth. Reptiles only: dry scales, ectothermic, mostly lay leathery eggs. Both: vertebrates, breathe air with lungs, need food and water. Use a white background, large labels, short phrases, and accessible blue and green outlines. Do not add traits beyond this list.
SaaS Product Comparison: Create a three-set Venn diagram comparing [Product A], [Product B], and [Product C]. Place the supplied capabilities into the exact exclusive, pairwise, and all-product regions. Use a clean 16:9 presentation style with concise labels and a small source note. Do not invent pricing, integrations, ratings, or security claims.
Audience Overlap from a CSV: Use @audience-segments.csv, sheet 'Segments', columns 'Email', 'Webinar', and 'Trial'. Create a three-set Venn diagram that summarizes the verified segment counts supplied in the file. Label every intersection, include the reporting period from cell B2, and add the review date supplied in the source. Do not infer missing membership or make circle areas proportional unless the supplied counts support and explicitly request that treatment.
Career Skills Comparison: Create a three-circle Venn diagram for Product Manager, UX Designer, and Software Engineer roles. Use the exact skills provided under each role and overlap. Highlight shared discovery skills for Product Manager + UX, delivery planning for Product Manager + Engineering, prototyping for UX + Engineering, and cross-functional communication in the center. Use a professional career-workshop style.
Research Methods Comparison: Read @methods-notes.pdf and create a two-set Venn diagram comparing qualitative interviews and structured surveys. Use only the sections marked 'approved comparison'. Separate data type, sample depth, analysis approach, shared research goals, and ethical requirements. Add a concise source line and flag any statement that is not directly supported by the file.
Brand Strategy Workshop: Create a three-circle Venn diagram for Customer Needs, Product Strengths, and Market Opportunity. Use the supplied workshop notes for each unique region and place only validated ideas in the pairwise and central overlaps. Use a warm editorial palette, readable labels, and generous whitespace for a leadership presentation. Do not invent market size, customer evidence, or product capabilities.