Free OnlineAI Graphic Organizer Generator
Turn a topic, passage, lesson plan, or uploaded document into a visual structure that supports the thinking task. Mew Design - AI Design Agent works as an AI graphic organizer maker for editable Venn diagrams, T-charts, KWL charts, Frayer models, story maps, sequence charts, cause-and-effect diagrams, and concept maps—ready for classroom handouts, study notes, presentations, or planning sessions.

How to Create a Graphic Organizer with AI

Begin with the relationship learners need to show—compare, sequence, classify, explain cause and effect, analyze a story, or connect concepts. The right structure makes that thinking visible without adding unnecessary visual load.
1

Define the Thinking Task

State the lesson or planning objective, audience, and response you need. Choose comparison, sequence, cause and effect, main idea and details, vocabulary analysis, narrative structure, prior-knowledge reflection, or research synthesis before choosing colors and decoration.
2

Add or Reference the Source

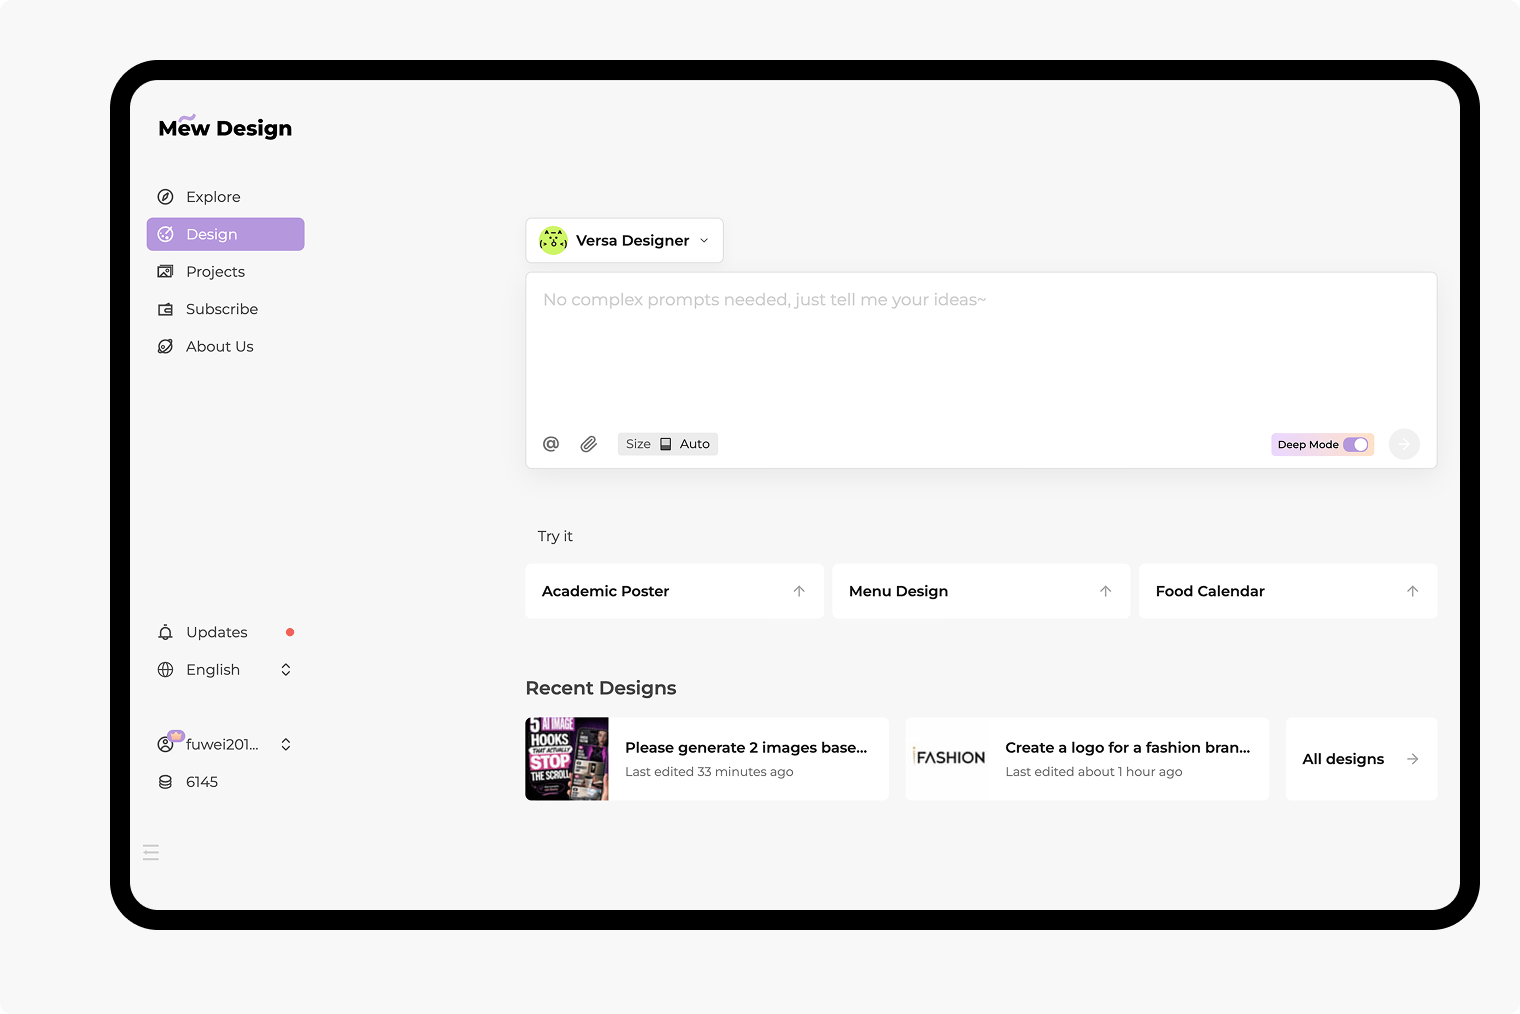
Paste the approved text, or upload a PDF, DOCX, XLSX, PPTX, CSV, text, Markdown, or another common document to the dedicated file library. Type @ to reference the file, identify the relevant pages or section, and specify whether you want source-based labels, guiding questions, a filled example, or a blank student version. Up to three documents can be referenced in one message.
3

Match the Organizer to the Relationship

Ask the AI graphic organizer generator for a Venn diagram or T-chart to compare, a sequence chart for order, a cause-and-effect chart for causal links, a story map for narrative elements, a Frayer model for vocabulary, or a concept map for connected ideas. Keep labels brief and leave enough room for the learner's response.
4

Review, Refine, and Export

Check names, dates, quotes, categories, prompts, and connector meaning against the source. Use Chat Edit to simplify instructions, move branches, add a word bank, create a blank or filled variant, improve contrast, or adapt the layout for print. Export the reviewed organizer as PNG, JPG, or PDF when that format fits your lesson or project.
How to create graphic organizers with AI

Graphic Organizers Built Around the Thinking Task

Choose Structure with a Purpose

A comparison, sequence, hierarchy, and causal explanation should not look the same. Describe the cognitive task and the AI design agent can organize the page around that relationship instead of forcing every topic into a generic mind map.

Create from Your Source Material

Upload lesson plans, reading packets, research notes, slide decks, spreadsheets, text, or Markdown, then reference the relevant file with @. An AI graphic organizer from PDF or another document can follow the selected section instead of relying only on a short standalone prompt.

Balance Scaffolds and Writing Space

Request section labels, question stems, sentence starters, examples, or a word bank while preserving room for student thinking. The layout can be simplified for younger learners or expanded for a detailed secondary, college, or professional task.

Make Blank and Filled Variants

Create a completed teaching model, a partially scaffolded version, and a blank printable graphic organizer from the same reviewed content. Check every filled answer before sharing it, then remove or shorten prompts to match the level of support students need.

Refine Relationships in Conversation

Use Chat Edit to rename a section, reorder a sequence, separate two categories, reverse an arrow, merge duplicate nodes, or change only the palette. You can preserve the useful structure while fixing one confusing relationship at a time.

Design for Print and Access

Ask for clear headings, readable type, generous response areas, and strong contrast. Combine color with labels, borders, symbols, position, or line styles so the organizer still communicates when printed in grayscale or viewed by someone who does not distinguish every color.

How to Write an Effective Graphic Organizer Prompt

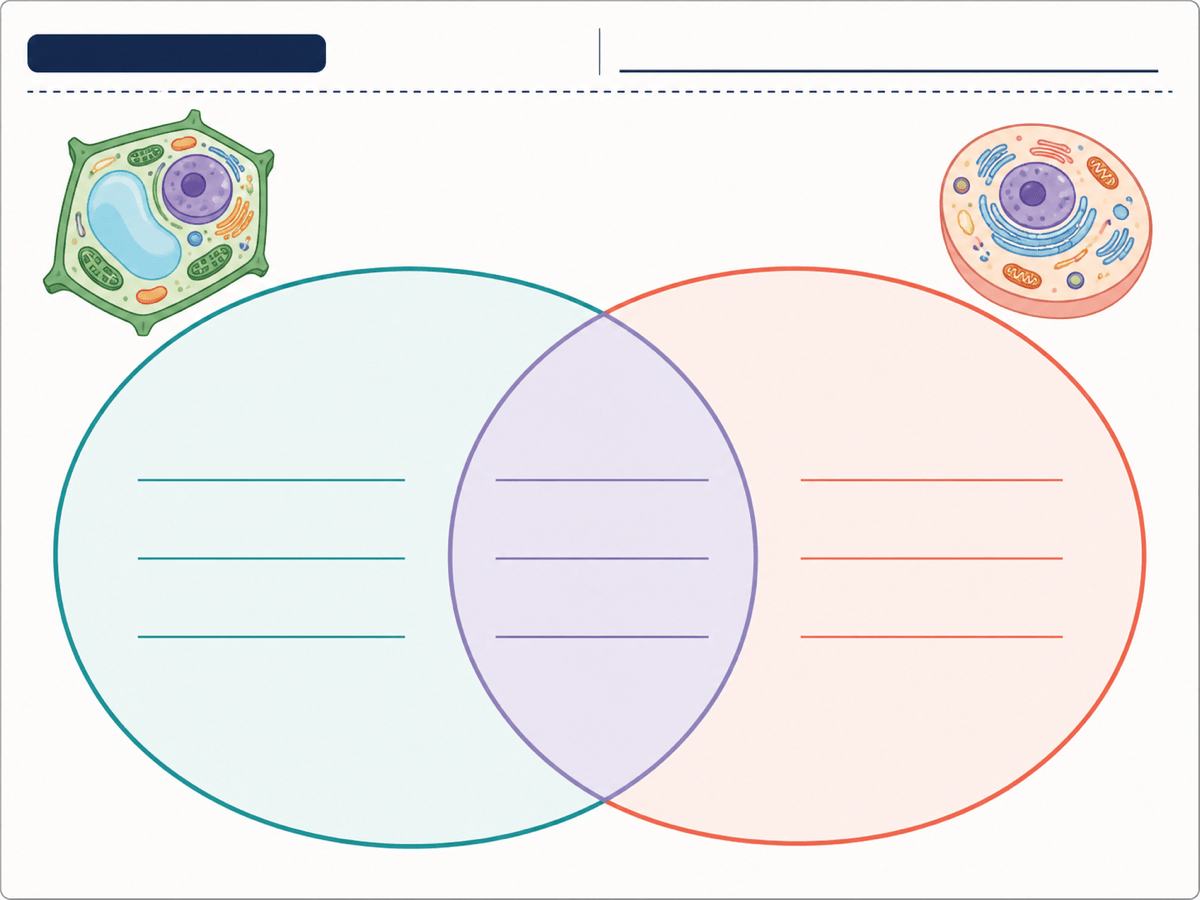
Create a 4:3 landscape compare-and-contrast graphic organizer for Grade 7 science using the verified content in @[cell-notes.pdf], pages 3–5. Use a two-circle Venn diagram labeled "Plant Cells" and "Animal Cells" with a shared center. Add four short guiding prompts in each outer section and three in the overlap, but leave the answers blank. Include a small word bank with 10 terms taken only from the source. Use high-contrast navy, teal, and coral with labels as well as color, large readable type, generous writing space, and a black-and-white-print-friendly structure. Do not invent organelles or functions.
A useful AI graphic organizer generator prompt names the thinking task, learner, source, required structure, level of scaffolding, and final format. If you use a document, reference it with @ and identify the exact pages, slide, sheet, or section so the source boundary is clear.
  • Start with the learning goal: Say what the learner must compare, sequence, classify, explain, define, plan, or synthesize. The goal determines the organizer more reliably than a decorative style request.
  • Name the scaffold level: Request blank, partially completed, or filled. Add a word bank, sentence starters, examples, non-examples, guiding questions, or page references only when they support the assignment.
  • Define connector meaning: State whether lines mean category membership, sequence, hierarchy, similarity, evidence, or causation. Ask for arrowheads only when direction matters.
  • Plan for use and access: Specify grade level, vocabulary difficulty, portrait or landscape format, print size, writing space, color and grayscale needs, contrast, and whether a text outline should accompany a complex digital organizer.

AI Graphic Organizer Prompts for Lessons and Research

Compare-and-contrast Venn diagram: Create a 4:3 graphic organizer for Grade 6 science comparing plant and animal cells. Label both circles and the overlap, add short prompts for structures and functions, leave student answers blank, provide a 10-term word bank, use high-contrast colors plus headings, and keep enough space for handwriting.

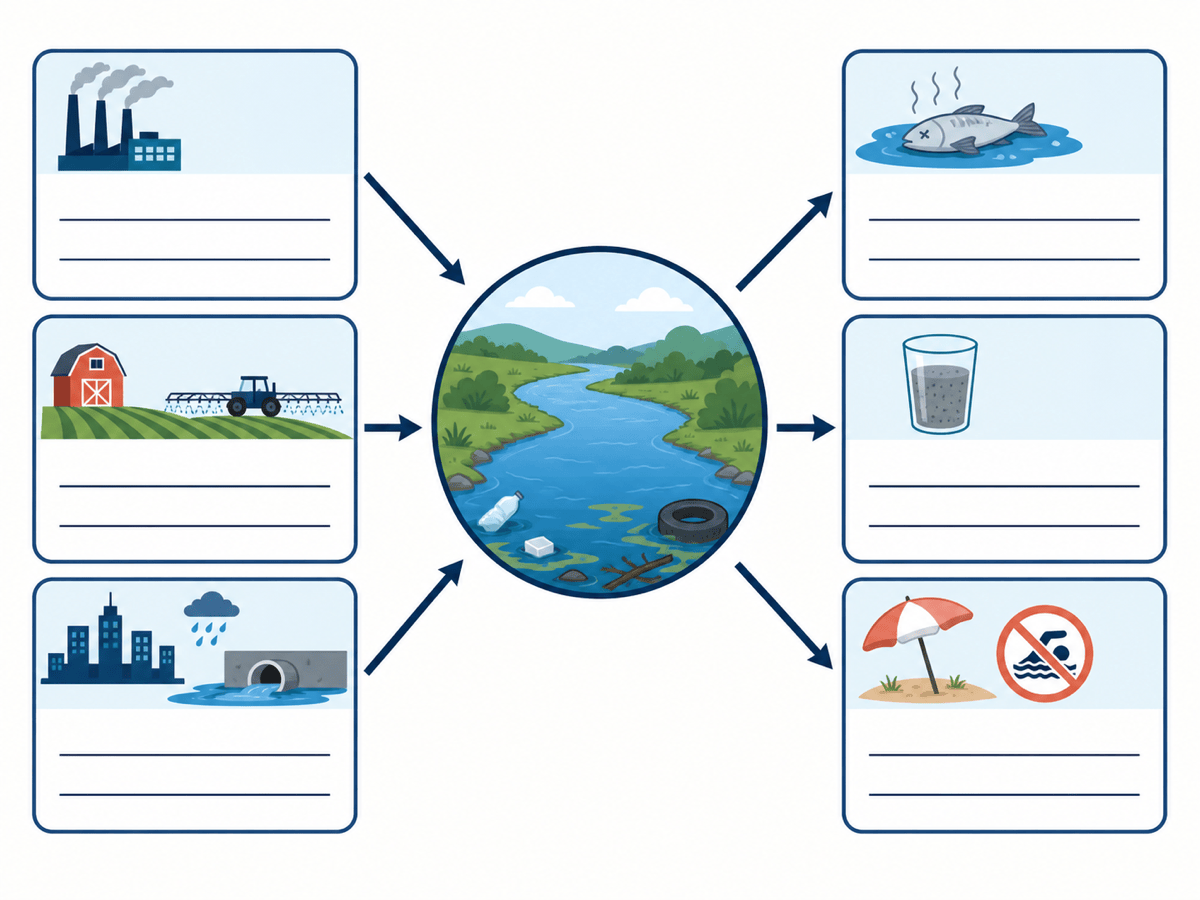
Cause-and-effect history chart: From @[industrial-revolution.docx], use only the section titled "Urban Change" to create a cause-and-effect organizer. Put three verified causes on the left, the central change in the middle, and four verified effects on the right. Use directional arrows, concise phrases, and a source note; do not add dates or claims that are not in the document.

Story map from a PDF: Read pages 8–18 of @[short-story.pdf] and create a portrait story map with labeled spaces for setting, main characters, conflict, three key events, climax, and resolution. Make one teacher model with concise source-based entries and one blank student version with guiding questions. Verify all names and events against the PDF.

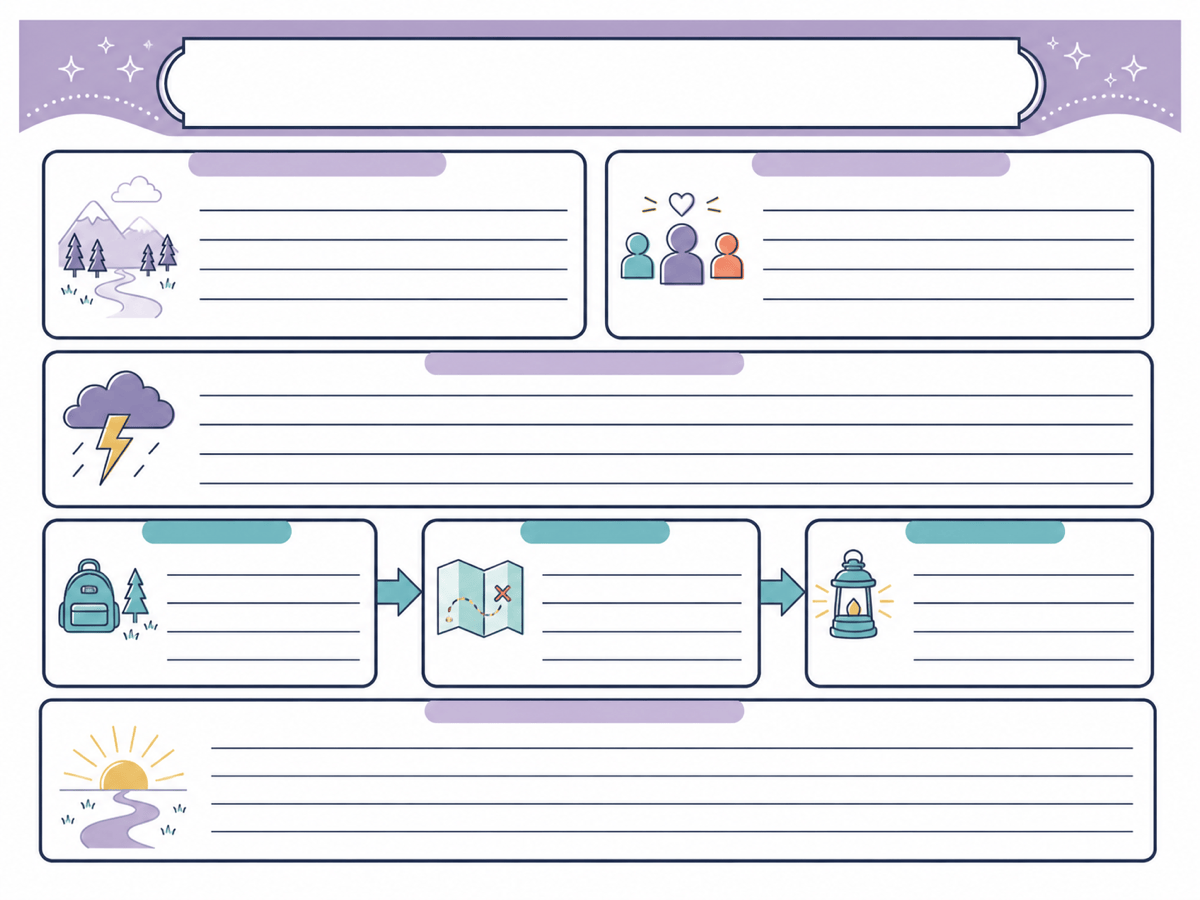
Life-cycle sequence: Design a landscape sequence graphic organizer for the butterfly life cycle with four numbered stages, simple original icons, one short prompt under each stage, and arrows that clearly show order. Use large type, black outlines, soft accessible colors, and no extra facts or decorative branches.

Frayer vocabulary model: Create a printable Frayer model for the term "ecosystem" with quadrants for definition, characteristics, examples, and non-examples. Add sentence starters but leave the response areas blank. Use Grade 5 language, a clear title, strong contrast, and a grayscale-friendly border system.

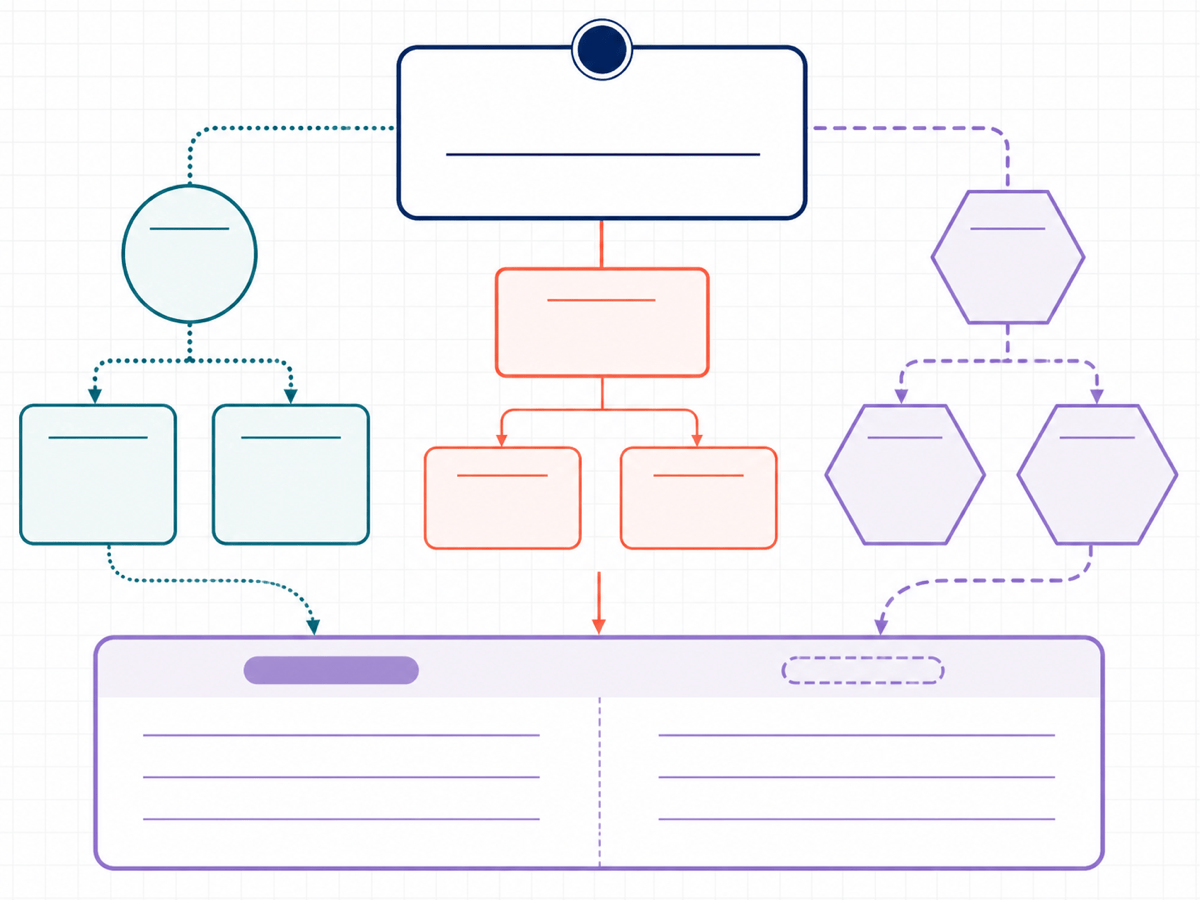
Multi-source research synthesis: Reference @[study-a.pdf], @[study-b.pdf], and @[notes.md]. Create a concept organizer around the research question I provide, with one branch per source, short evidence nodes, and a final similarities-and-differences section. Label each claim with its source, keep uncertainty visible, and do not merge findings that conflict.

AI Graphic Organizer Generator FAQs

Yes. New users receive free AI credits to generate and refine an initial design. You can use Chat Edit for revisions and download completed artwork without a watermark; credit use depends on the generation workflow you choose.
You can request Venn diagrams, T-charts, KWL charts, Frayer models, story maps, sequence charts, cause-and-effect diagrams, main-idea-and-details organizers, hierarchy charts, and concept maps. A custom layout can also combine structures when the relationship is explained clearly.
Match the shape to the thinking task: Venn or T-chart for comparison, sequence chart for order, cause-and-effect chart for causal links, story map for narrative elements, Frayer model for vocabulary, KWL for learning reflection, and concept map for hierarchical or associative relationships. For free-form radial brainstorming, try the AI mind map generator.
Yes. Paste text directly, or upload PDF, DOCX, XLSX, PPTX, CSV, text, Markdown, and other common document formats to the file library. Reference a file with @ and identify the exact pages, sheet, slide, or section. You can reference up to three documents in one message; always verify generated facts and relationships against the source.
Yes. Ask for a blank worksheet, a partially scaffolded version, or a filled teaching model. Specify paper size, portrait or landscape orientation, response-space needs, black-and-white printing, and the exact prompts that should remain visible. Review filled content before using it as an answer guide.
Yes. Use Chat Edit to rename sections, shorten prompts, reorder steps, fix connector directions, change colors, increase writing space, add a word bank, or create a second version for another audience without restarting the whole brief.
Mew Design can read referenced content and use it while creating the design, but AI extraction and summarization still require review. Check every name, quote, date, category, causal claim, and answer against the original material before assigning, presenting, or publishing the organizer.
Export PNG or JPG for slides and learning platforms, or PDF for a printable handout when that format fits the project. For a complex digital organizer, also provide a short text outline or equivalent structured content, and use labels, shapes, or line styles in addition to color. For a broader visual summary, use the AI infographic generator.

Ready to Generate Designs With AI?

Get Started - 50 Free Credits
No credit card required
© 2025 - 2026 Mew Design, MAGOAI LTD.All rights reserved.
Mew Design - Your AI design partner, now with full control. | Product Hunt